
category
使用graphviz和Pydot包创建有向图
In the first part of this series, I shared how to create a flowchart using the SchemDraw package. In the second part, I described creating a directed acyclic graph with NetworkX package while exploring the characteristics, centrality concept and retrieving all possible paths from root node to the leaves. This part will focus on constructing directed acyclic graphs using the graphviz and pydot packages. I shall also explain a bit about the styling and attribute options with the graphviz. Let’s get started.

graphviz package
Graphviz is an open-source graph visualisation software. The graphviz package, which works under Python 3.7+ in Python, provides a pure-Python interface to this software. This package allows to create both undirected and directed graphs using the DOT language.
Constructing the Graph or DiGraph object using graphviz is similar to that using NetworkX in the sense that one needs to simply define the nodes and edges of the graph object and assign the attributes accordingly. However, there are some key differences as well. For example, in the NetworkX package, the node can be defined as any hashable object (except None). But in graphviz, a node can only be defined as a string.
In my previous post, I pointed out the different limitations of graph visualisation with the NetworkX package, such as limited options for node shapes, limitation for getting unique shape and bounding box (bbox) attributes for individual nodes, etc. In this post, I am going to share how the graphviz package not only overcomes those limitations, but also offers much more flexibility options for graph visualisation. I am going to depict this by reconstructing the organogram created using NetworkX in the previous post, but using graphviz in this post.
Plotting Organogram using graphviz
To create a plain organogram using graphviz package, I start with initializing a graph object say f as graphviz.Digraph(filename) , where filename is the name of the output file created. I created a list of eight names starting from A to H, and the list of all the positions held in the company. Next, by going through a for loop, I created eight nodes for each name and added the corresponding position of the individual in the organisation as labels. I specified the edges between the CEO and two team leads, and team leads and their corresponding staff. The code for the same is as given below:
import graphvizf = graphviz.Digraph(filename = “output/plain organogram 1.gv”)names = [“A”,”B”,”C”,”D”,”E”,”F”,”G”,”H”]positions = [“CEO”,”Team A Lead”,”Team B Lead”, “Staff A”,”Staff B”, “Staff C”, “Staff D”, “Staff E”]for name, position in zip(names, positions):
     f.node(name, position)

#Specify edges
f.edge(“A”,”B”); f.edge(“A”,”C”) #CEO to Team Leads
f.edge(“B”,”D”); f.edge(“B”,”E”) #Team A relationship
f.edge(“C”,”F”); f.edge(“C”,”G”); f.edge(“C”,”H”) #Team B relationship

f
As a result, I get a plain organogram graph as shown below:
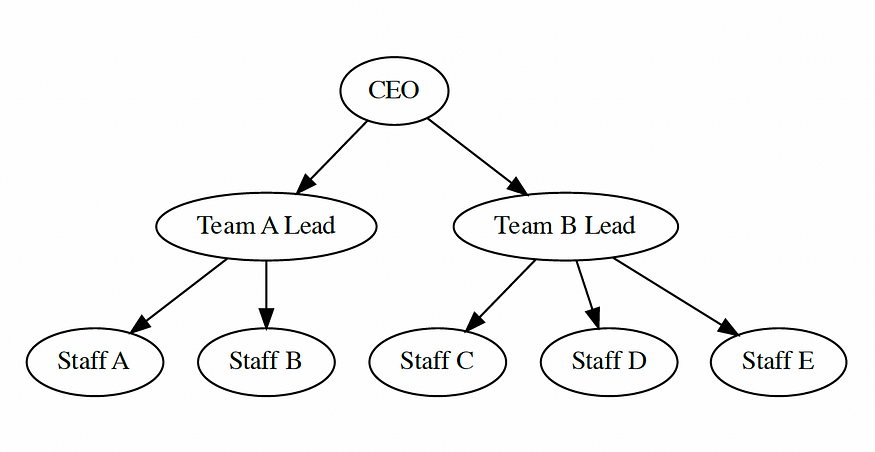
In the graph above, the size of each node is adapted automatically to fit the labels within the node. This was not the case with the NetworkX package.
Styling and attributes with the graphviz package
As mentioned earlier, the graphviz package offers various styling options and attributes to customise the graphs. Some of these possibilities are described below in detail:
Node shapes
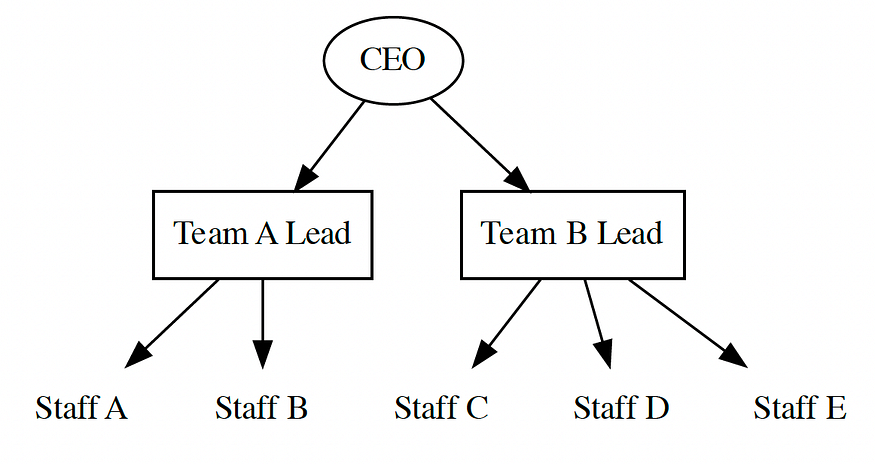
The default shape of node in the graph created using graphviz is ellipse. It is possible to get a wide variety of shapes for nodes using graphviz, which can be found here. These shapes could be polygon-based, record-based, or user-defined. Moreover, it is also possible to get different shape for different nodes. In the code below, I changed the shape of node for the CEO to oval, box shape for the two team leads, and just plaintext for the staff.
import graphvizf = graphviz.Digraph(filename = "output/plain organogram 2.gv")names = ["A","B","C","D","E","F","G","H"]positions = ["CEO","Team A Lead","Team B Lead", "Staff A","Staff B", "Staff C", "Staff D", "Staff E"]for name, position in zip(names, positions):
    if name == "A":
        f.node(name, position, shape = "oval")

    elif name in ["B","C"]:
        f.node(name, position, shape = "box")
    else:
        f.node(name, position, shape = "plaintext")#Specify edges
f.edge("A","B"); f.edge("A","C")   #CEO to Team Leads
f.edge("B","D"); f.edge("B","E")   #Team A relationship
f.edge("C","F"); f.edge("C","G"); f.edge("C","H")   #Team B relationship

f
Node color and edge color
It is also possible to assign different color to different nodes and edges using graphviz. I created a list of colors and then assigned a color for each node using the for loop in the code below. I assigned black color to the CEO, blue color to team A, and red color to team B. In the same fashion, I assigned blue color to the edges connecting team A, and red color to the edges connecting team B.
import graphvizf = graphviz.Digraph(filename = "output/colorful organogram 1.gv")names = ["A","B","C","D","E","F","G","H"]positions = ["CEO","Team A Lead","Team B Lead", "Staff A","Staff B", "Staff C", "Staff D", "Staff E"]colors = ["black", "blue", "red", "blue", "blue", "red", "red", "red"]for name, position, color in zip(names, positions, colors):
    f.node(name, position, color = color)

#Specify edges
#CEO to Team Leads
f.edge("A","B", color = "blue", label = "A"); f.edge("A","C", color = "red", label = "B")
#Team A
f.edge("B","D", color = "blue"); f.edge("B","E", color = "blue")
#Team B
f.edge("C","F", color = "red"); f.edge("C","G", color = "red"); f.edge("C","H", color = "red")

f

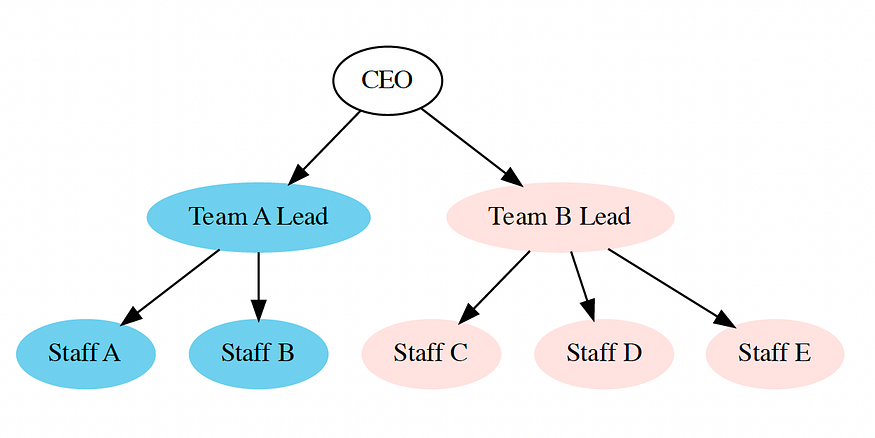
Fill nodes with colors
In this step, I customised the graph further by filling the color inside the nodes. It is done simply by stating style = “filled" while defining the nodes and assigning the color.
import graphvizf=graphviz.Digraph(filename='output/filled_colorful_organogram.gv')names = ["A","B","C","D","E","F","G","H"]positions = ["CEO","Team A Lead","Team B Lead", "Staff A","Staff B", "Staff C", "Staff D", "Staff E"]colors = ["black", "skyblue", "mistyrose", "skyblue", "skyblue", "mistyrose", "mistyrose", "mistyrose"]for name, position, color in zip(names, positions, colors):
    if name== "A":
        f.node(name, position, color = color)
    else:
        f.node(name, position, style = "filled", color = color)

#Specify edges
f.edge("A","B"); f.edge("A","C")   #CEO to Team Leads
f.edge("B","D"); f.edge("B","E")   #Team A relationship
f.edge("C","F"); f.edge("C","G"); f.edge("C","H")   #Team B relationship

f
Running gv file from the terminal
The digraph object f can be displayed in the output Graphviz DOT file of the gv extension and saved using f.view(). It is also possible to print the source code of this digraph object written in the DOT language, simply by using f.source in the notebook.
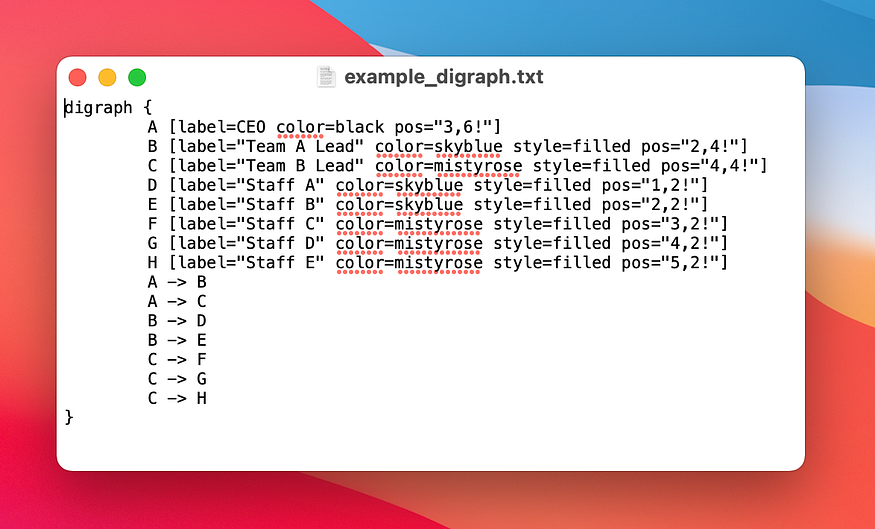
The txt file above contains the source code of the digraph in the DOT language. I have specified the x and y position of the nodes manually using pos. This file can be run in the terminal using the following code:
dot -Kfdp -n -Tjpeg -Gdpi=300 -O example_digraph.txt
It generates the digraph object as a jpeg file with 300 dpi resolution.
Pydot package
The pydot package is an interface to Graphviz. It is written in pure Python, and it can parse and dump into the DOT language used by Graphviz. A folder tree structure in a computer comprising of a directory, sub-directory, files, etc. is also an example of a directed graph. In the following section, I am going to explain how the pydot package can be used to get the folder tree structure.
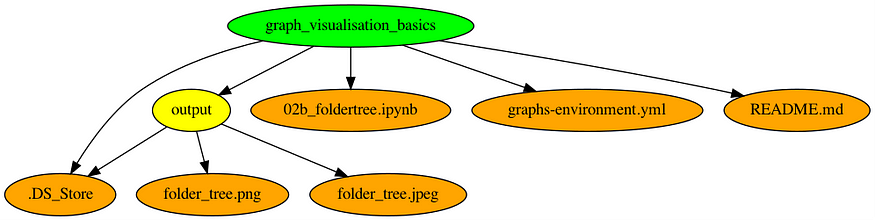
Folder tree using Pydot package
I start with creating a directed graph object called G. The os module in Python provides a portable way of using operating system-dependent functionalities. os.getcwd() returns the current working directory including the path, which I assign as rootDir. From the rootDir, I get the name of the directory only (graph_visualisation_basics) and pass it as currentDir. I add a node for currentDir and fill it with green color. By using a for loop, I define the nodes for each subdirectory and file and add edges between them. Next, I fill the nodes for subdirectory with yellow color and the files with orange color. At the same time, I ignore the hidden folders whose name starts with a ..
The image of the graph object is created using Image(G.create_jpeg() and displayed by passing it through IPython.display.display(). The image file is saved in jpeg format using G.write_jpeg(filename), where filename is the name of the file saved.
Conclusion
This is the third part of the series on graph visualisation basics with Python. The motivation behind this series was to share the simple techniques I learned while creating flowcharts, and graph objects in Python using packages such as SchemDraw, NetworkX, and graphviz. In this post, I described how a directed graph object could be created using the graphviz package using the example of an organogram. I also showcased the various options for styling and adding attributes to the graph components offered by graphviz. Towards the end, I shared how the folder tree structure in a system could be constructed as a graph using the Pydot package.
The notebooks for the posts in this series are available in this repository. Thank you for reading!
- 登录 发表评论